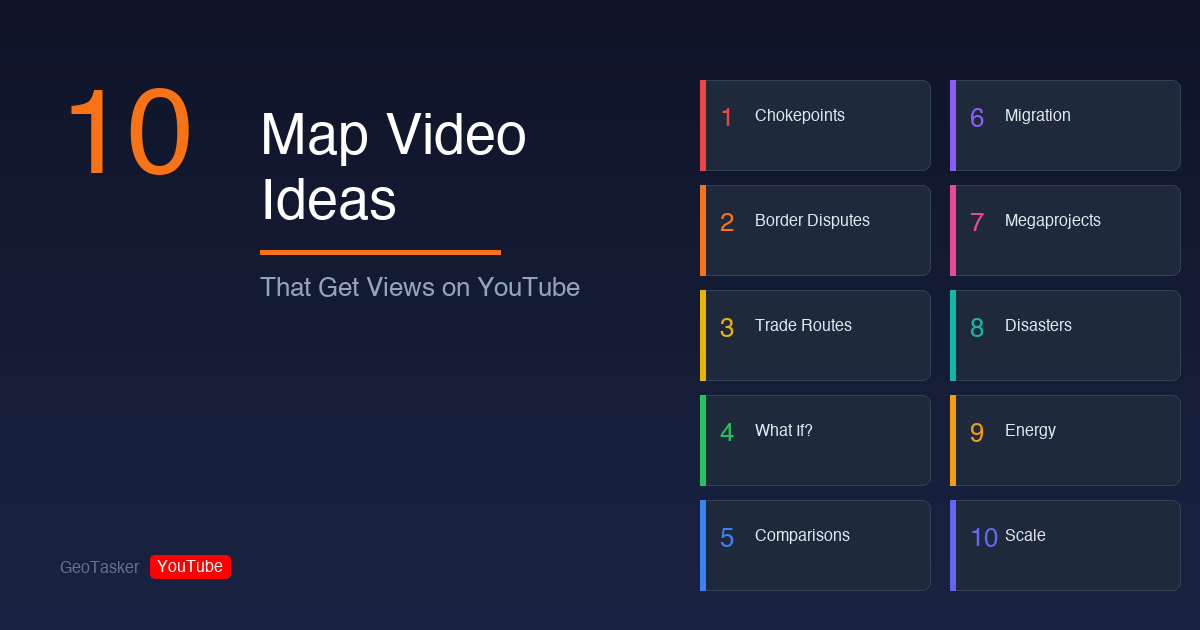
10 Map Video Ideas That Get Views on YouTube
Proven map video formats that consistently perform well on YouTube. Each idea includes a ready-to-use GeoTasker prompt so you can create your own.
10 Map Video Ideas That Get Views on YouTube
Map videos are one of the most reliable content formats on YouTube. Channels like RealLifeLore, Vox, and VisualPolitik pull millions of views with animated maps, and the format works at every scale — from 30-second Shorts to 20-minute deep dives.
Here are 10 proven formats with ready-to-use GeoTasker prompts.
1. The Chokepoint Explainer
Why it works: People are fascinated by single geographic points that control global trade, military power, or migration. Strait of Hormuz, Suez Canal, Strait of Malacca — these videos consistently hit 500K+ views.
Prompt:
"Create a video about the Strait of Hormuz. Show why 40% of global oil passes through this narrow waterway, the countries that border it, and what would happen if it were blocked. Use shipping route animations and oil production charts."
What GeoTasker does: Real maritime routes via searoute (not straight-line arcs), country boundaries, oil production bar charts, and narrated segments explaining the strategic importance.
2. The Border Dispute
Why it works: Contested borders are inherently dramatic. India-China, Israel-Palestine, Russia-Ukraine — the combination of maps and context drives engagement and debate in comments.
Prompt:
"Create a video about the Kashmir border dispute. Show the Line of Control, territories controlled by India, Pakistan, and China, and how the borders have shifted since 1947. Use choropleth maps with different colors for each country's claim."
What GeoTasker does: Real boundaries from OpenStreetMap, choropleth coloring by controlling country, camera movements between disputed zones, historical context in narration.
3. The Trade Route History
Why it works: Ancient trade routes (Silk Road, Spice Route, Trans-Saharan) combine history, geography, and economics. These videos have long shelf life — they keep getting views years after publishing.
Prompt:
"Create a video about the ancient Silk Road trade routes. Show the overland route from Xi'an to Constantinople and the maritime spice routes through Southeast Asia. Include what goods were traded at each stop."
What GeoTasker does: Draw-on route animations following real paths, city markers with labels, commodity charts at key trading hubs, globe projection for the full east-to-west sweep.
4. The "What If" Scenario
Why it works: Hypothetical geography triggers curiosity clicks. "What if the Mediterranean Sea dried up?" "What if Africa was never colonized?" These titles get massive CTR.
Prompt:
"Create a video about what would happen if the Panama Canal was permanently blocked. Show the alternative shipping routes around South America, the impact on global trade times, and which countries would be most affected. Compare transit times with charts."
What GeoTasker does: Maritime route comparison (Panama vs Cape Horn), transit time bar charts, affected country choropleths, dramatic narration about economic fallout.
5. The Country Comparison
Why it works: Side-by-side comparisons (USA vs China, India vs Pakistan, Japan vs Germany) tap into national identity and rivalry. Racing bar charts showing GDP, military, or population over time are especially engaging.
Prompt:
"Create a video comparing the economies of the G7 countries from 1980 to 2025. Show GDP growth as a racing bar chart, map each country with choropleth coloring by GDP, and highlight key economic events like the 2008 crash and COVID."
What GeoTasker does: Racing bar chart with animated rankings, choropleth map with GDP-based coloring, text segments for key events, narrated timeline.
6. The Migration Story
Why it works: Human movement is inherently emotional. Refugee crises, historical diasporas, or economic migration patterns combine data with human stories.
Prompt:
"Create a video about the Syrian refugee crisis. Show where 8 million refugees went — Turkey, Lebanon, Jordan, Germany, and beyond. Use arc animations showing movement from Syria to destination countries, with a chart showing numbers per country."
What GeoTasker does: Arc entities with icons showing migration flows, destination country boundaries, refugee count bar charts, satellite basemap for dramatic feel.
7. The Infrastructure Megaproject
Why it works: Massive construction projects (Belt and Road, Channel Tunnel, Trans-Siberian Railway) are visual by nature. People want to see the scale on a map.
Prompt:
"Create a video about China's Belt and Road Initiative. Show the land routes through Central Asia and the maritime routes through the Indian Ocean to Africa and Europe. Highlight key port investments and railway connections."
What GeoTasker does: Multiple maritime routes via searoute, overland routes as layer tracks, port city markers, investment value charts, globe projection showing the full scope.
8. The Natural Disaster Map
Why it works: Earthquake zones, hurricane paths, volcano locations — disaster content is evergreen and spikes during actual events. The Ring of Fire alone has hundreds of videos with millions of views.
Prompt:
"Create a video about the Pacific Ring of Fire. Show the tectonic plate boundaries, mark major volcanoes and earthquake zones, and highlight the 5 deadliest earthquakes in history with their locations and death tolls."
What GeoTasker does: Plate boundary lines as layer tracks, volcano markers with labels, earthquake location markers sized by magnitude, death toll charts, dark basemap for dramatic effect.
9. The Energy Map
Why it works: Oil, gas, nuclear, renewables — energy geopolitics drives views because it connects to gas prices, wars, and climate change. Everyone has a stake.
Prompt:
"Create a video about who controls the world's oil. Show the top 10 oil-producing countries with a choropleth map, major oil shipping routes through key chokepoints, and a racing bar chart of oil production from 2000 to 2025."
What GeoTasker does: Production choropleth, shipping routes via searoute through Hormuz/Suez/Malacca, racing bar chart of production over time, pipeline routes as layer tracks.
10. The "How Big Is It Really?" Scale Video
Why it works: Map projections distort our perception of size. Videos showing Africa's true size vs Europe, or overlaying Texas on top of France, consistently surprise people and drive shares.
Prompt:
"Create a video showing how map projections distort country sizes. Compare the Mercator projection sizes of Greenland, Africa, and South America, then show their true areas. Include an area comparison bar chart."
What GeoTasker does: Globe projection showing true sizes, boundary overlays for size comparison, area bar chart with real vs perceived sizes, narrated explanation of Mercator distortion.
Tips for Maximum Views
- Hook in the first 2 seconds — GeoTasker's title overlay is designed for this. The map starts moving from frame 1.
- Use the right basemap — Satellite for military/conflict, dark for dramatic data, light for clean comparisons.
- Include charts — Racing bar charts especially. They keep viewers watching to see who "wins."
- Make it a Short too — Every long-form video has a 30-second version. Ask GeoTasker for both formats.
- Post consistently — Map videos compound. Your 10th video will get more views than your 1st because YouTube recognizes the niche.
Two Videos From One Prompt
After creating a standard 16:9 video, ask GeoTasker: "Now make a YouTube Short version of this." You get two pieces of content from the same research.
Ready to Start?
Pick any prompt above, paste it into geotasker.ai, and you'll have a publish-ready video in under a minute. No editing, no After Effects, no map software.
The geo-content niche is still wide open. Most creators avoid it because animated maps are hard to make. That's your advantage.
All prompts above work as-is in GeoTasker. Try one now
Create Your Own Geospatial Story Videos
GeoTasker uses AI to transform your ideas into stunning animated map videos with narration, captions, and music.
Try GeoTasker Free